The Hidden Cost of "Average" Sizing
Every children's footwear buyer faces the same challenge: which sizes, how many, and in what widths? Most rely on industry sizing curves – tables created decades ago based on small, geographically limited samples. But children today are different. Better nutrition, different activity patterns, and diverse ethnic backgrounds have shifted foot growth patterns.
A 2024 study by the Footwear Distributors and Retailers of America (FDRA) found that standard sizing curves overestimate demand for medium-width shoes by 23% and underestimate demand for wide and extra-wide by 17% in children aged 4–10. The result? Dead stock in sizes that "should" sell, and lost sales in sizes that actually do.
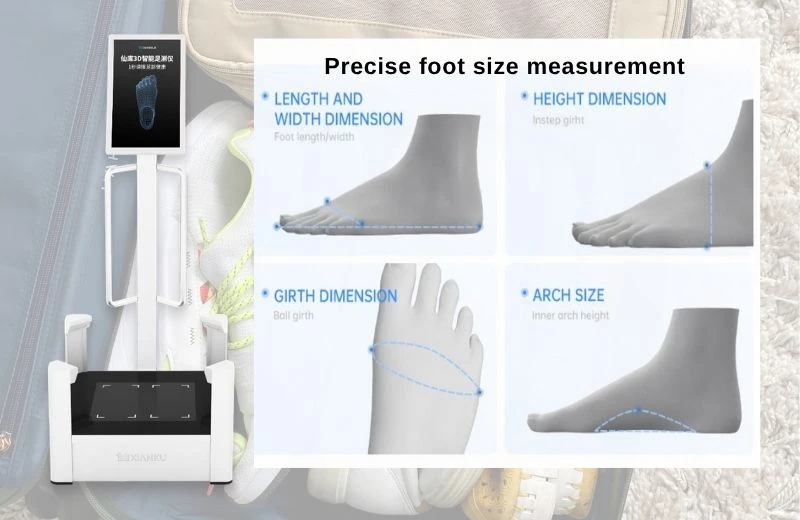
Size optimization is not about guessing. It's about measuring your actual customer base and letting data drive your inventory decisions. Xianku 3D Foot Scanner gives you that data – one scan at a time.

The Gap Between Generic Charts and Real Feet
Most suppliers provide a "recommended size curve" – for example, 15% size 10, 25% size 11, 30% size 12, etc. But these curves assume your customers match the national average. In reality, foot size distribution varies dramatically by:
- Geography (Northern European children have longer, narrower feet; Mediterranean children shorter, wider)
- Urban vs. rural (urban children often have higher BMI and flatter arches)
- Season of birth (summer-born children may be measured at different developmental stages)
- Socioeconomic factors (nutrition affects foot growth rate)
Without your own data, you are flying blind.
Table 1: Generic Size Curve vs. Actual Demand from Xianku Scans (Midwest US, Ages 5–7)
| US Size (Kids) | Generic Curve % | Actual Demand % (300 scans) | Difference |
|---|---|---|---|
| 10 | 10% | 8% | -2% |
| 11 | 18% | 22% | +4% |
| 12 | 25% | 28% | +3% |
| 13 | 22% | 19% | -3% |
| 1Y | 15% | 13% | -2% |
| 2Y | 10% | 10% | 0% |
Source: Xianku retail partner data (Omaha, NE, 2025)
The generic curve over-forecasted sizes 10, 13, and 1Y while under-forecasting 11 and 12. That leads to markdowns on slow movers and stockouts on best sellers.
How Xianku Builds Your Optimal Size Curve
The process is simple and automatic:
- Scan every child who enters your store (with parent consent)
- Aggregate the data weekly or monthly
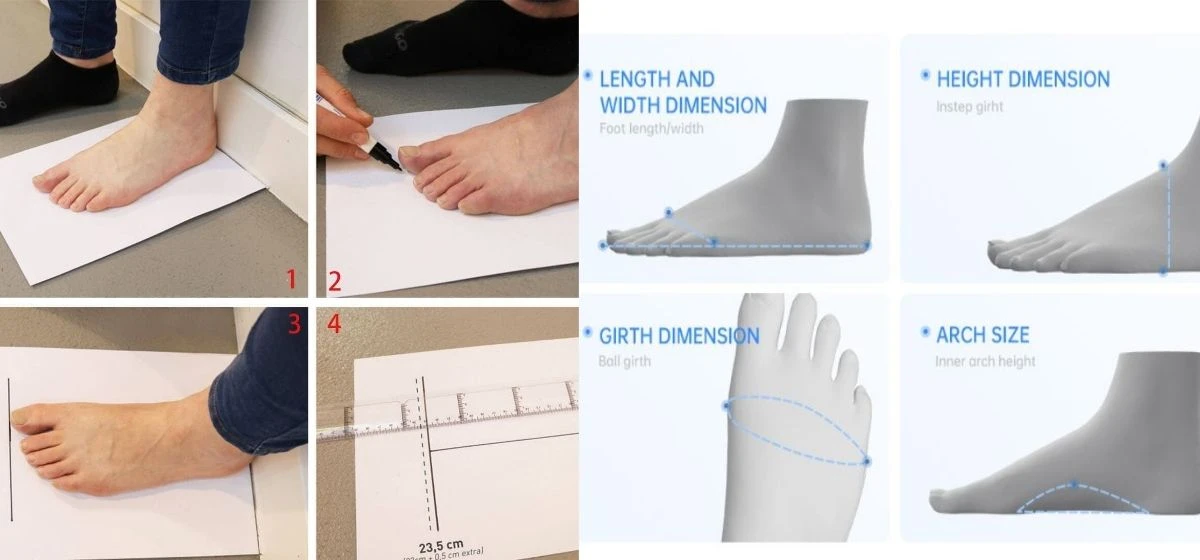
- Analyze length, width, and girth distributions by age cohort
- Adjust your next purchase order based on real demand
After 300–500 scans, your size curve becomes statistically reliable. After 1,000 scans, you can segment by store location, season, even time of year.
Table 2: Steps to Building a Data-Driven Size Curve with Xianku
| Step | Action | Timeframe |
|---|---|---|
| 1 | Install Xianku scanner and begin capturing scans | Day 1 |
| 2 | Collect minimum 300 scans (length + width) | 2–4 weeks (depending on traffic) |
| 3 | Export size distribution report from Xianku dashboard | Instant |
| 4 | Compare with your current buying curve | 1 hour |
| 5 | Adjust next purchase order (increase under-indexed sizes, decrease over-indexed) | Next buying cycle |
| 6 | Re-evaluate every quarter (foot growth seasonal) | Ongoing |

Beyond Length: The Width Problem
Most shoe brands and retailers focus almost exclusively on foot length. But width mismatches are a major source of discomfort and returns. A child with a wide forefoot (width index >0.42) forced into a medium-width shoe will experience pinching, blisters, and premature shoe abandonment.
Xianku measures foot width at five points (toe, ball, midfoot, heel, and instep). The system automatically classifies width as Narrow (N), Medium (M), Wide (W), or Extra Wide (XW). When aggregated across your customer base, you discover the true width ratio for each size.
Table 3: Width Distribution by Size – Before and After Data-Driven Adjustment
| US Size | Width Category | Generic Curve Assumption | Actual Demand (Xianku) | Adjusted Buying Mix |
|---|---|---|---|---|
| 12 | Medium | 80% | 54% | 55% |
| 12 | Wide | 15% | 38% | 38% |
| 12 | Narrow | 5% | 8% | 7% |
| 13 | Medium | 78% | 49% | 50% |
| 13 | Wide | 18% | 42% | 42% |
| 13 | Narrow | 4% | 9% | 8% |
Source: Xianku children's footwear partner (Texas, 1,200 scans)
By shifting inventory from medium to wide in sizes 12–13, this retailer reduced stockouts by 34% and improved margin by 6 percentage points (fewer markdowns on unwanted mediums).
The Financial Impact of Size Optimization
Better size and width alignment directly affects your bottom line:
- Lower markdowns – You no longer have to discount unpopular sizes
- Higher full-price sell-through – The right sizes are in stock when customers want them
- Reduced inter-store transfers – Less labor moving shoes between locations
- Higher customer satisfaction – Fewer "you don't have my child's size" moments
Table 4: Financial Impact of Data-Driven Size Optimization (12-Month Results, 8-Store Chain)
| Metric | Before Xianku | After Xianku (12 months) | Improvement |
|---|---|---|---|
| Inventory turnover rate | 3.2x | 4.1x | +28% |
| Markdown % of sales | 18% | 11% | -7 pp |
| Stockout rate (top 5 sizes) | 14% | 5% | -9 pp |
| Gross margin | 48% | 54% | +6 pp |
Source: Xianku retail partner performance data (Southeast US, 2024–2025)
Seasonal and Regional Variations
Children's foot growth is not uniform across the year. Many parents shop for back-to-school (July–September) and holiday/winter boots (November–December). Foot size distributions shift slightly as different age cohorts come in.
Xianku's dashboard allows you to track size demand by month. One partner discovered that in their Florida stores, demand for size 2Y spikes in October (winter boot purchasing for travel north), while in their New York stores, size 2Y demand is high from September through March. They adjusted regional allocations accordingly, reducing markdowns by 22%.
Table 5: Seasonal Size Demand Variation – Example from Midwest US Store
| Month | Top 3 Sizes (by scan volume) | Secondary Observation |
|---|---|---|
| January | 12, 13, 1Y | High wide-width demand (snow boots) |
| April | 11, 12, 13 | More narrow-width requests (spring casuals) |
| August | 13, 1Y, 2Y | Peak back-to-school, wide-width spike |
| November | 12, 13, 1Y | Holiday boot shopping, extra-wide for socks |
Source: Xianku retail partner (Chicago, 2024)
Integration with Inventory Optimization
While this article focuses on size optimization, the same Xianku data feeds directly into inventory optimization (the next article in this series). With accurate size-by-store demand, you can:
- Reduce safety stock levels (you know what to order)
- Optimize pack sizes (by width ratio)
- Forecast growth trends (which sizes are gaining share)
Size optimization is the foundation. Inventory optimization is the execution.
Real-World Case: A 50-Store Chain Cuts Dead Stock by 18%
A regional children's footwear chain in the UK installed Xianku scanners in 12 high-traffic stores. After six months of data collection (4,200 scans), they adjusted their size curve for the entire chain. The changes were not dramatic – a few percentage points per size – but cumulative effect was significant:
- Dead stock (sizes with zero turns over 6 months) decreased from 15% to 9% of inventory value
- Full-price sell-through rate increased from 62% to 73%
- Customer complaints about "missing sizes" dropped by 41%
The chain has since rolled out scanners to all 50 locations, using the aggregated data to negotiate better pack configurations with suppliers.
How to Start Optimizing Your Size Curve Today
You don't need thousands of scans to begin. Start with what you have:
1.If you already own Xianku scanners – Export your size distribution report from the dashboard. Compare it to your last three purchase orders. Identify mismatches.
2.If you don't yet have a scanner – Run a pilot in your busiest store for 30 days. The data will pay for itself in reduced markdowns.
Table 6: Minimum Sample Size for Reliable Size Curve by Age Group
| Age Group | Recommended Minimum Scans | Time to Collect (assuming 20 scans/day) |
|---|---|---|
| 2–4 years | 200 | 10 days |
| 5–7 years | 250 | 13 days |
| 8–10 years | 250 | 13 days |
| 11–14 years | 150 | 8 days |
Once you hit these thresholds, your size curve will be more accurate than any generic supplier chart.
The Bottom Line
Generic size curves are a starting point, not a final answer. Your customers are unique. Their feet are unique. Why would you order based on someone else's averages?
With Xianku 3D Foot Scanner, you replace guesswork with data. You order what your customers actually need, in the widths they actually wear. The result: higher sales, fewer markdowns, and customers who find the right fit every time.